Static Code Analysis and Quality Metrics
Date Published: 08 July 2016

This is post 1 of 1 in the series “Measuring and Managing Software Quality”
Resources for measuring and assessing software quality.
Assessing the quality of software can be a difficult, often subjective process. Having some heuristics and metrics that measure an application’s source code provides a useful starting point, and observing these metrics over time can identify important trends. Is the application getting harder to maintain, or easier? Is the source code more tightly coupled today than it was last week? How much grossly repetitive code is there? How big and complex are the program structures? Metrics and heuristics can inform us of these questions, and other tools can help ensure we’re notified if our code exceeds certain agreed-upon thresholds for any metrics we deem to be important. In this article, I’ll outline some metrics, tools, and rules I’ve found particularly helpful for teams to utilize the assess, monitor, and over time improve their software quality.
Basic Code Metrics
Over the years, many metrics have been devised for analyzing software source code. They range from the simplest, program length or lines of code, to more complex measures like cyclomatic complexity. Microsoft’s Visual Studio provides support for measuring these metrics and several more. The different metrics make sense at different levels of abstraction within an application:
Maintainability Index – Microsoft’s index that ranges from 0 to 100, where higher values indicate better maintainability. This index can be useful, more so at the method level than the class/namespace/project level. It aggregates several metrics into one index. Visual Studio provides color coding to go with it, which is where this measure goes off the tracks, in my opinion. Somehow the color coding considers anything between 20 and 100 to be “good maintainability”, while 10 to 19 is “moderately maintainable” and 0 to 9 is “low maintainability”. Trust me when I tell you that a value of 20 for this index does not represent “good maintainability”. If the index must be color-coded, I would recommend something more along the lines of 76-100=Good/Green; 25-75=Moderate/Yellow; 0-24=Low/Red.
Cyclomatic Complexity – This measure can be calculated for many different languages and has been used for decades. It measures the unique logical paths that can be taken through a code structure. It is primarily of value at the method level, since at higher levels it is difficult to know whether a higher number indicates a class with a single very complex method, or several small, relatively simple ones. At the method level, you should strive for a cyclomatic complexity of less than 10. Values between 10 and 20 should be rare, and values over 20 indicate substantially complex methods that should be on your watch list to refactor. Generated code will often have a high cyclomatic complexity, and should typically be ignored as you assess and monitor your own code quality. Tools like NDepend (see below) make it easy to segment the analysis of your own code from included or generated code (Visual Studio’s support for these metrics does not, except at the project level).
Depth of Inheritance and Class Coupling – These two metrics apply at the class level, and lower numbers are generally better. High depth of inheritance indicates a more complex object hierarchy, and the more unique types a class references, the less stable it is, since any changes to any of these referenced types can break the class in question.
Lines of Code – This measure is based on the IL code and is approximate. I primarily use this metric at the method level, but it can be useful as a means of comparing the overall size of two classes, projects, or applications. When applied to methods, just as with cyclomatic complexity, lower numbers are preferable. Any method that you can’t view in its entirety on your screen (without a tiny font size or the use of regions) is probably too long.
Additional Metrics
For additional metrics, there are several third-party tools available. My preference is for NDepend, which is the most mature product available for .NET/C#. Full disclosure, as a Microsoft MVP I’ve received a free license for NDepend (and, for that matter, Visual Studio). NDepend actually supports more kinds of metrics than I want to show here – view the complete list. Here are a few I find particularly useful (in addition to the ones listed above).
Number of Methods – Classes with too many methods may be trying to do too much, or in any case may be more difficult to maintain. Twenty is a reasonable threshold for investigation.
Number of Fields – As with methods, having too many fields can indicate a maintenance issue. Twenty is a reasonable threshold for investigation.
Afferent Coupling – Inbound coupling from types outside of the assembly.
Efferent Coupling – Outbound coupling, determined by the number of types outside an assembly that are used by child types of the assembly.
Relational Cohesion – Average number of internal relationships per type. Types within an assembly should relate closely to one another, but should not be overly coupled. NDepend recommends a range of 1.5 to 4.0 for this metric.
Instability and Abstractness – These measures apply to assemblies, and can be used to determine the assembly’s distance from main sequence, which is where the measures of instability and abstractness total 1. Assemblies that are far from the main sequence may be useless (if overly abstract) or painful to work with (if overly concrete and depended upon).
Type Rank – Similar to Google Page Rank, NDepend’s TypeRank algorithm calculates which types are most critical to an application. High TypeRank types should generally be the most well-tested and best designed, since bugs in these types will tend to have higher impact on the application.
Method Rank – Similar to Type rank (and Google Page Rank), MethodRank can be used to identify the methods that are of greatest importance to an application.
Number of Parameters – The number of parameters to a method. Methods with too many parameters are more difficult to call and are often more complex.
Number of Variables – The number of variables declared within a method. Larger numbers frequently correspond to methods that are more difficult to maintain.
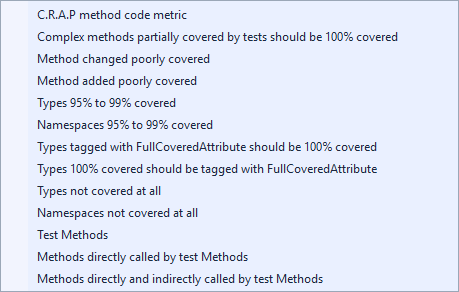
Both NDepend and Visual Studio also support code test coverage tools, which can be used to identify areas of code that are/are not covered by automated test cases. In my experience these have limited usefulness, since code coverage is rarely meaningful in its raw % form. What’s more meaningful is seeing a breakdown of test coverage compared to defect density or code complexity. You want to have more tests around your most complex code, and around the areas of your code where bugs continue to be found. It can also be useful to see that the code % coverage is at least staying constant or improving, especially in legacy systems that were written with no tests. Beyond the simple % number for code coverage, NDepend provides many built-in queries to help you get more out of your code coverage data:
Visualizing Metrics
NDepend supports a code metrics view that offers a treemap of the analyzed code (either in its GUI, or within Visual Studio as shown below). The default view shows methods organized such that the size of each box is representative of the method’s number of lines of code (LOC), and the color gradient is representative of the method’s cyclomatic complexity. This screenshot shows the Code Metrics View for Dapper, a popular micro-ORM project (click to enlarge):
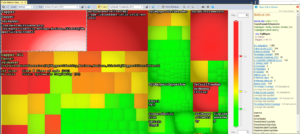
In this view, red boxes represent methods with a complexity of at least 30. The largest box, in the top left, is a method with almost 250 lines of code. If you were looking for places to reduce complexity, this view can help you easily visually identify “hot spots” in a codebase. We’ll look more at using different tools to analyze code later in this series.
Trend Metrics
Many metrics are more valuable when you consider how they are trending. The basic code coverage percentage score is one I would include in this category. It’s not that interesting what your code coverage percentage is, but if it’s staying steady or improving, that’s good. If it’s plummeting because the team has abandoned testing altogether, that’s probably a bad sign.
Visual Studio doesn’t support trend metrics directly, though you could certainly manually track metrics of interest in a spreadsheet if you so desired. NDepend does offer this support, either standalone through its tooling or in the form of reports that can be integrated into a continuous integration server.
Most of the metrics listed above can be tracked as trend metrics in NDepend. Some that I find more interesting to track help identify where problems are beginning, so that these can be nipped in the bud before they get out of hand.
Average Lines of Code for Methods – You can tweak this so there’s a minimum, otherwise things like auto properties will throw it off. The built-in rule looks at the average for methods with at least three lines of code. You don’t want this to be perpetually growing.
Average Lines of Code for Types – Same as above but for types. You want to keep this steady or shrinking.
Average Cyclomatic Complexity for Methods – Again, you’ll want to add a minimum number of lines of code to this one, so it’s not skewed by properties, etc. Keep this one as low as possible. Watch for big spikes or steady climbs.
Average C.R.A.P Score – This acronym stands for Change Risk Analyzer and Predictor. I haven’t personally used it much, but NDepend has built-in support for calculating it.
Aggregate Complexity – This is a metric I’ve developed myself that attempts to aggregate cyclomatic complexity to the type or project level. It’s similar, but better, than the average CC for Methods metric listed above, since it’s more clear what an ideal value is (zero). Read more about how to calculate it here.
Summary
When it comes to objectively assessing a codebase, if you’ve not explored this space before, you may be surprised how many different metrics there are that can be utilized. In fact, the sheer number of them can sometimes be overwhelming. In the next article I’ll talk about some specific rules that build on these metrics and can be used to identify problem areas in the code. These rules can be set up similar to compiler errors and warnings, depending on their severity.
Category - Browse all categories

About Ardalis
Software Architect
Steve is an experienced software architect and trainer, focusing on code quality and Domain-Driven Design with .NET.