Measuring Aggregate Complexity in Software Applications
Date Published: 13 August 2018
A variety of tools will let you measure the complexity of a given method in your .NET applications. If you have a high-end SKU of Visual Studio, it will calculate code metrics for your application, one of which is Cyclomatic Complexity (CC). You can also use tools like NDepend, which I highly recommend if you want to quickly gain deep insight into large, complex codebases. Cyclomatic complexity measures the number of possible paths execution could take through a given function. Simple functions that have no branching will have a complexity of 1. A large, complex method with many different if clauses and/or switch statements may have a much higher CC score. A general guideline for CC is that it should be kept under 10 whenever possible, that 20 is pretty bad, and that anything over 30 is probably not maintainable. There are some exceptions to this, but generally it's a reasonable rule of thumb and when analyzing code to look for problem areas, identifying the highest CC values is often a good place to start.
When analyzing classes with auto-properties (or just many small methods), you'll frequently see many CC values of 1 yielded because each get and set method will have a complexity value of 1. This makes it difficult to use cyclomatic complexity as a heuristic or benchmark for classes, namespaces, or projects/assemblies. What's a good number for a class? Should you just look at the sum? The average? How can we compare a class with 20 properties with another class with a single method with a complexity of 20? The answer is, you really can't. Cyclomatic complexity is only useful as a method or function measure. It breaks down for at class and higher levels.
Cyclomatic complexity is only useful as a method or function measure.
Aggregating Complexity
I've found a way to aggregate complexity from Cyclomatic Complexity that can offer some value when comparing two classes, or two projects. It uses a point-based system and low-complexity methods result in 0 points, so large numbers of minimally complex methods do not impact aggregate scores. My current version of this approach is very simple but seems to be effective in my experiments with it so far. The aggregate complexity is the sum of the complexities of all methods within the class (or project) divided by 10, dropping all fractions. Thus, methods with complexities of 1-9 add 0 to the aggregate score. Methods with complexities of 10-19 add 1, 20-29 add 2, and so forth. It's possible with this approach to have a class or project score 0 overall for its aggregate complexity. In fact, it can even do so with a large number of CC 9 methods. Like any aggregation technique, some details are lost. However, as a gross comparison tool or as a heuristic to use to drive up code quality, these aggregate values seem to work. They certainly work better than simply summing up raw CC values. As a tool for driving code quality, this aggregate can help refactoring efforts to focus where they'll move the needed. Small, relatively simple methods won't affect the score, while large complex methods will. Thus, developers hopefully won't spend effort trying to "fix" methods that are already pretty straightforward while ignoring the massive bug-prone methods.
A possible argument against using this heuristic might be that it doesn't detect really long methods or methods with way too many properties. Yes, that's true, but that's not its intent. We already have line of code (LOC) heuristics that can easily work for this, and which apply much better at class and project level (as well as method level) than CC does. We could also easily use a tool like NDepend to find classes that exceed a certain number of properties, fields, methods, etc.
I've created two NDepend queries that can be used to capture these values on a per-type and per-project basis.
Aggregate Type Complexity (ATC)
Aggregate Type Complexity (ATC) sums up method complexity using a point system where complexity levels of 1-9 are 0 points, 10-19 are 1 point, 20-29 are 2 points, etc. Types that only have methods with less than 10 complexity will have an ATC score of 0. Higher scores represent legitimate complexity within types, not just the presence of many single-path methods or properties.
//
let aggregateTypeCC = t.MethodsAndContructors.Sum(m => m.CyclomaticComplexity / 10) let rawCC = t.MethodsAndContructors.Sum(m => m.CyclomaticComplexity)
// optional optimization if not comparing rawCC // where aggregateCC >= 10
orderby aggregateTypeCC descending select new { t, aggregateTypeCC, rawCC }
Here's a screenshot of the results of this query. The second item is a generated dataset with over 200,000 LOC. It seems like it has a large amount of complexity, but it's almost completely properties. It's generated code, so probably you'd just ignore it anyway, but it demonstrates the difference in aggregate complexity you get using my point-based rule compared to just summing raw CC values. 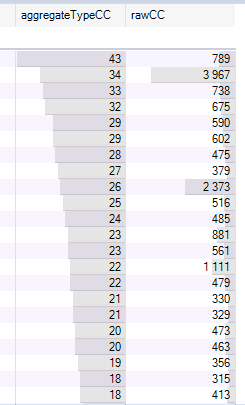
Aggregate Project Complexity (APC)
Aggregate Project Complexity (APC) sums up method complexity using a point system where complexity levels of 1-9 are 0 points, 10-19 are 1 point, 20-29 are 2 points, etc. Projects that only have classes with methods with less than 10 cyclomatic complexity will have an APC score of 0. Higher scores represent legitimate complexity within projects/assemblies, not just the presence of many single-path methods or properties on the contained types.
//
let aggregateCC = a.ChildTypes.ChildMethods().Sum(m => m.CyclomaticComplexity / 10) let rawCC = a.ChildTypes.ChildMethods().Sum(m => m.CyclomaticComplexity)
// optional optimization if not comparing rawCC // where aggregateCC >= 10
orderby aggregateCC descending select new { a, aggregateCC, rawCC }
Here's an example result. Notice the 4th row, which represents a project full of DTOs and generated Datasets with very little functionality.
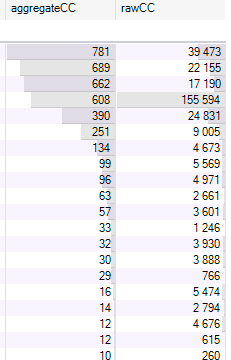
This is an analysis run on a large enterprise codebase with literally hundreds of assemblies. It pretty clearly highlights to me where the most complexity lies, as opposed to sorting by raw complexity. For instance, when sorting by raw complexity, one project in the top 10 has a rawCC value of about 5500, but its APC value is only 2. Likewise a WCF reference project has a rawCC value over 1500 but its APC value is 0. Avoiding false positives like these is one of the values of this different metric for aggregation.
Visual Studio Metrics and Excel
You can also calculate aggregate complexity using Visual Studio and Excel. First, open your solution and calculate code metrics. Then export to Excel. Next, filter the first column, Scope, to just Member. This will include just the methods in the project or solution.
Now add a new column (should be column L typically) called Aggregate Complexity on the first row. In the following rows, add a formula that divides the cyclomatic complexity value in that row by 10 and rounds down. It should look something like this:
=ROUNDDOWN(G5/10,0)All that remains is to add a new cell, which can be on a separate sheet if you like, that sums all of the rows in your new Aggregate Complexity column:
=SUM(Sheet1!L5:Sheet1!L67967)That's it. Now you have your number and you can start working on driving it down toward zero as you improve your design.
Summary
Performing software analysis, including architectural review, code quality reviews, etc. is something I do for many of my clients. It's a relatively low-cost, high-value activity that can shine a light on where potential problems are most likely to exist in a large and/or growing codebase. Sometimes the analysis is being done by management as a way to make an informed, risk-based decision about whether or how to re-architect or rewrite some code. Sometimes it's done on an ongoing basis as a means of vetting code being produced by a partner. And other times it may be a part of due diligence as part of a potential acquisition. In any case, static analysis tools like NDepend are invaluable for being able to quickly query into large amounts of code and to run rules that can flag potential problems with warnings or even build failures. For the largest codebases, cyclomatic complexity at the method level may not suffice, and metrics like Aggregate Type Complexity and Aggregate Project Complexity can be useful for highlighting where the bodies are buried, in terms of nasty, bug-prone code.
Contact me if you'd like me to help you analyze your application for quality, performance, security, and more.
You can find the latest versions of these NDepend queries and more in this GitHub repository. Feel free to submit PRs to add your own rules you've found useful, too!
Category - Browse all categories

About Ardalis
Software Architect
Steve is an experienced software architect and trainer, focusing on code quality and Domain-Driven Design with .NET.