Simple Flowcharts and State Diagrams with WebGraphViz
Date Published: 20 December 2017
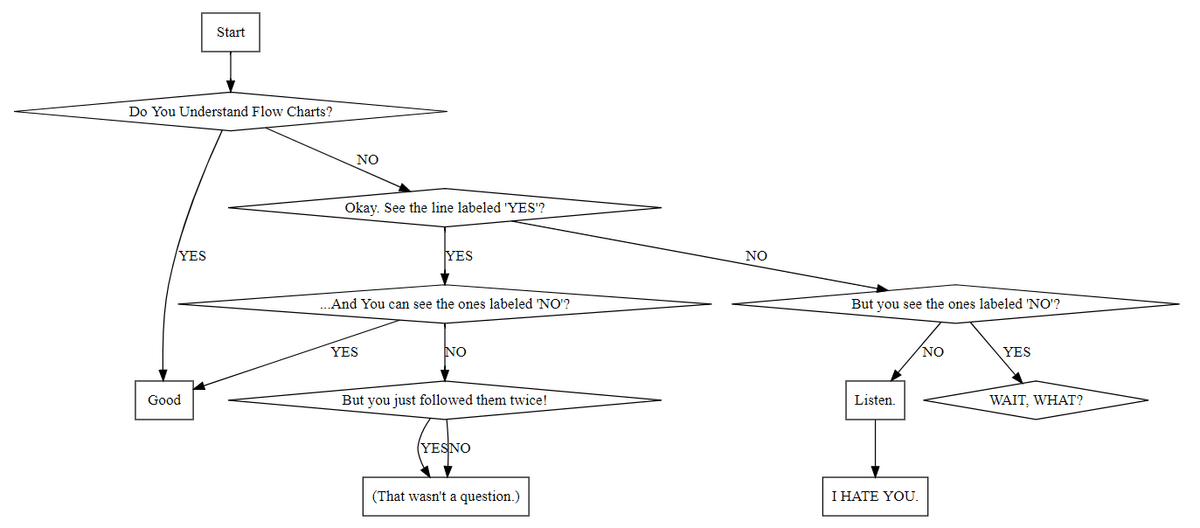
I've used the GraphViz tool locally to quickly produce graphs and state diagrams from text input. Recently (2017), I learned about WebGraphViz, which lets you do the same thing from a browser. For instance, if you want to teach someone how to use a flow chart, you could send them to this classic XKCD comic, or you could generate your own similar flowchart by copying and pasting the following into WebGraphViz.com:
digraph finite\_state\_machine {
	size="8,5"
	node \[shape = rectangle\]; Start Good "Listen." "I HATE YOU." "(That wasn't a question.)";
	node \[shape = diamond\]; "Do You Understand Flow Charts?";
	Start -> "Do You Understand Flow Charts?";
	"Do You Understand Flow Charts?" -> "Okay. See the line labeled 'YES'?" \[ label = "NO" \];
	"Do You Understand Flow Charts?" -> Good\[ label = "YES" \];
        "Okay. See the line labeled 'YES'?" -> "...And You can see the ones labeled 'NO'?" \[ label = "YES" \];
        "Okay. See the line labeled 'YES'?" -> "But you see the ones labeled 'NO'?" \[ label = "NO" \];
        "But you see the ones labeled 'NO'?" -> "WAIT, WHAT?" \[ label = "YES" \];
        "But you see the ones labeled 'NO'?" -> "Listen." \[ label = "NO" \];
        "Listen." -> "I HATE YOU.";
        "...And You can see the ones labeled 'NO'?" -> Good \[ label = "YES" \];
        "...And You can see the ones labeled 'NO'?" -> "But you just followed them twice!" \[ label = "NO" \];
        "But you just followed them twice!" -> "(That wasn't a question.)" \[ label = "YES"\];
        "But you just followed them twice!" -> "(That wasn't a question.)" \[ label = "NO"\];
}
This should generate a chart like this: 
The benefit of using a tool like GraphViz/WebGraphViz to generate these kinds of graphs, flow charts, and state diagrams is that you can store the source in source control in a format that can easily be diffed. Unlike diagrams created using special software, the source code for these graphs is fairly easy to follow and is in any event simply plain text. I recently used this technique to describe the allowable state transitions of a domain object that I was modeling with a client as part of a GitHub issue. It was simple to work out the state diagram interactively on WebGraphViz's web site and then to copy and paste the source text as well as the generated image into a GitHub issue.
One thing I would very much like to see WebGraphViz add is the ability to store and version your own graphs on their site, like JSFiddle/JSBin et al allow. For now, you need to store your graph-generating source code somewhere else, so don't forget to copy it out of the WebGraphViz window before you close it or navigate away.
Update 2021
More recently, I've been using PlantText.com and its support for PlantUML. It supports most kinds of diagrams you might need, from class design to sequence diagrams to state flows to building layouts. One nice thing about these tools, as noted above, is that you can just copy/paste the text and images into your repository either as code or just issues, as shown here.
Category - Browse all categories

About Ardalis
Software Architect
Steve is an experienced software architect and trainer, focusing on code quality and Domain-Driven Design with .NET.