Real World Monitoring and Tuning ASP.NET Caching
Date Published: 08 September 2010
First off, let me direct you to a great article on monitoring your ASP.NET cache API behavior. Go read that first, then come back here.
Done? Good, so let’s make the advice from Simon’s blog a bit more concrete with some real-world examples.
Consider this fairly high-traffic web server’s behavior (avg. 55 ASP.NET requests/sec, 110 max, at the moment):
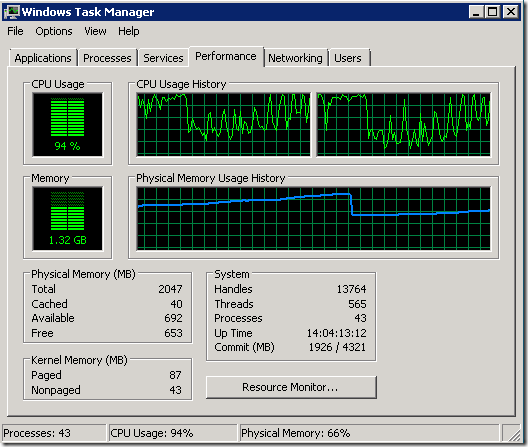
Notice how the RAM sort of falls off a cliff, and at that same moment, CPU is much higher than usual? That’s the behavior we want to diagnose (I’ll save the answer for a moment). As it happens, this same pattern recurs constantly, and is exhibited on multiple machines within the web farm running this application.
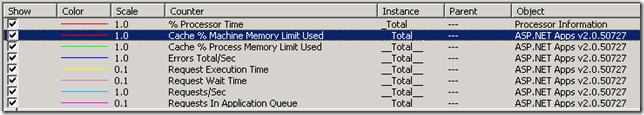
Looking at perfmon, the following counters are useful:
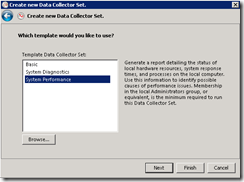
Watching Task Manager and Perfmon provides some nice, immediate feedback, but it’s not very good for analysis or for sharing with anybody else. For that, it’s better to collect some data. From within the Performance Monitor application, you can create a Data Collector Set (more here). Simply open up Data Collector Sets – User Define and right-click, New – Data Collector Set. Name it something and choose to Create manually:

Next, choose System Performance to pull things from performance counters.
You can continue and set the logfile location and the data collector set or just finish here. Then edit/add a data collector to the set (right click, New – Data Collector) and specify that it’s a Performance Counter. Now add some counters to it. I recommend the following (replace vXXX with v2.0.50727 for .NET 2 or v4.0.30319 for .NET 4 RTM):
ASP.NET Apps vXXX – Cache % Machine Memory Limit Used
ASP.NET Apps vXXX – Cache % Process Memory Limit Used
ASP.NET Apps vXXX – Cache Total Entries
ASP.NET Apps vXXX – Cache Total Trims
ASP.NET Apps vXXX – Cache Turnover Rate
ASP.NET Apps vXXX – Request Execution Time
ASP.NET Apps vXXX – Request Wait Time
ASP.NET Apps vXXX – Requests Executing
ASP.NET Apps vXXX – Requests / Sec
ASP.NET vXXX – Requests Current
ASP.NET vXXX – Requests Queue
Processor – % Processor Time
Finally, Start your Collector Set. I suggest setting a limit on the counters to collect, or the log file size, and ideally put your log on a separate disk partition so when you forget about it and it fills up, your web site doesn’t die due to lack of system drive space.
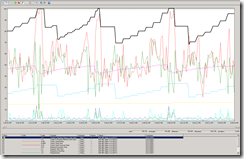
If your application is active, you probably don’t need to run this for very long. 10 minutes or an hour might be enough. Of course, you can run it all night or all week long if you like, but be sure you have enough disk space. You may want to increase the frequency with which counters are polled if you’ll be running this over an extended period of time. Below is a report showing my data collection from a period of about 15 minutes. Each view below is the same period of time, with a different counter highlighted (click to enlarge):
Figure 1: Cache % Machine Memory Limit Used
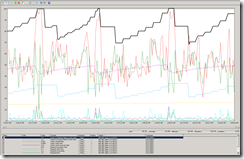
Figure 2: % Processor Time
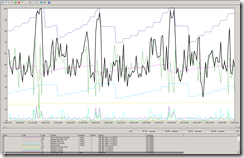
Figure 3: Cache Total Entries
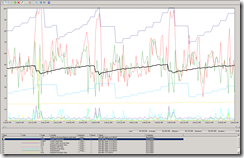
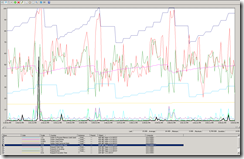
Figure 4: Cache Total Turnover Rate

Figure 5: Request Execution Time
Analyzing the Report Data
So now that we have 15 minutes of live data, what does it tell us? Well, the first thing to do when analyzing performance data is to try and identify where performance is suffering. There are two counters to look at for ASP.NET individual request performance: Execution Time and Wait Time. Execution Time measures how long the request took to execute, and Wait Time measures how long the requests sat in a queue prior to being processed at all. If Wait Time is non-zero, your site will have serious performance problems, since any wait times are added to execution times when consider the client’s total load time for a given request. In this case, Wait Time is zero, so that’s good at least.
Looking at Figure 5, the Request Execution Time is spiking periodically. It’s not tracking 100% with the CPU spikes, but there is one massive spike about 2 minutes into the data that corresponds with the first CPU spike as well as Cache % Process Memory Limit Used hitting 100%. Looking at Figures 1 through 4, it’s pretty clear that whenever that % memory limit hits 100, the cache is trimmed (note that drop in total cache items in Figure 2), resulting in a spike in Cache Turnover, and requiring more CPU. In terms of the performance impact, the average execution time for this application is 64ms, but its maximum during the spike was 5709ms – 5.7 seconds! That’s a performance decrease of about 790%. It’s brief, but it’s also predictable and preventable.
Coming Up With a Theory
My theory based on the above evidence is that the machine is running into its memory limit, and this is resulting in the ASP.NET cache algorithm running its scavenging process (learn more about this process here), which will go through and remove roughly half of the items in the cache starting with the ones that are Least Recently Used (LRU). This then is resulting in additional CPU load as those formerly cached data items must now be recreated by the application (most likely resulting to a flurry of new database requests, as well), as well as applying the logic of the scavenger to tens of thousands of items in the cache. In order to test this theory, I adjusted the application’s cache memory limit. In the web.config file, in the <system.web> section, add the following:
<caching>
  <cache percentagePhysicalMemoryUsedLimit="90"
         privateBytesLimit="4000000000" />
</caching>
The percentagePhysicalMemoryUsedLimit defaults to 80%. Setting it to 90 should change the point at which the cache trims occur, and they should occur somewhat less frequently. The other limit, privateBytesLimit, is set above to 4GB, which is more RAM than my server actually has, so it’s effectively infinite (the 90% limit will always hit first). The Cache % Process Memory Limit Used performance counter goes against this value.
After making this change, I again observed the system to see how it behaved. Task Manager is actually nice for this because it shows the % of Memory used. These two screenshots are about 10 seconds apart:
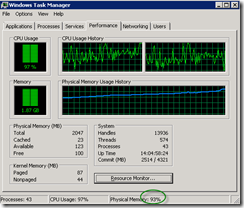
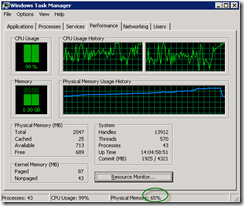
You can see that once the memory went over 90%, the CPU jumped and the trim occurred. When it was done, memory was down to 65%. The trims don’t occur exactly at 90% because the ASP.NET Cache is only monitoring physical memory usage periodically.
Fixing The Problem
So now it appears we’ve diagnosed the issue and determine that it’s an issue with over-consumption of memory by our application. There are three things we immediately do to address the problem, in order of difficulty:
1) Increase the % of machine RAM our application can use. I can turn the dial up to 100%. Unfortunately, this baby doesn’t go to 110%, so if I do that, I’m out of flexibility here. This requires only a config change – no coding or hardware changes. In fact I already did this by going from 80% (the default) to 90%, but the issue didn’t disappear. Unfortunately I don’t have much hope that going to 100% would be sufficient.
2) Cache Less Stuff. I can reduce how much data I’m storing in the ASP.NET cache. There are a few ways to do this. One is to simply eliminate caching of certain data sets entirely. The other is to introduce more aggressive expiration policies. The application currently makes aggressive use of SQL Cache Invalidation, so that whenever anything in the database changes, the cache related to the tables involved is invalidated. However, there isn’t much in the way of arbitrary, time-based expiration. By adding some time-based cache expiration, I can reduce the total cache footprint, and I can adjust this by “adjusting the dial” for how long I allow things to remain in the cache. The tradeoff here is that I’ll be hitting the database more frequently (and ironically, to get stuff that I know hasn’t changed, since I’m using SQL Cache Invalidation). But it should generally be the case that the cache expirations occur over a range of time rather than all at once, as is happening currently when the memory limit is being hit.
This requires some code changes and probably some configuration changes – since I expect to want to be able to dial in the correct number of minutes to use as an absolute cache duration, I’m going to want to set that up as a configurable element (but not in appSettings, and not by adding it to an existing, general site config). I’ll create a new configuration element, most likely, with just a few separate cache duration knobs that relate to the biggest cached data sets in my application.
3) Throw Hardware At The Problem. I can get more RAM. Unfortunately, I think some of the web servers in my farm are maxed out at 2GB of RAM. Thus, I would need to upgrade whole servers in order to address the issue, and even then I might only be pushing the problem out a bit further, since it’s likely the application’s aggressive cache policy would eventually eat up even a much larger amount of RAM. In the short term, because the application is loosely coupled, adjusting the cache policy is the simplest approach.
In this case, the data that’s being cached is all coming from classes that implement a repository interface, and the caching is all done in subclasses of these interfaces (using the Decorator pattern). Thus, all caching logic is contained in a few, cohesive classes, making this change very straightforward.
I haven’t made the change to the caching policy yet, but once I do I’ll try and post a follow-up with the new app behavior.
Update – Here’s Part 2 of Real World Monitoring and Tuning ASP.NET Caching.
Category - Browse all categories

About Ardalis
Software Architect
Steve is an experienced software architect and trainer, focusing on code quality and Domain-Driven Design with .NET.