Generate Code Coverage Reports with ReportGenerator in Azure DevOps
Date Published: 17 July 2019
Last updated: 13 October 2023
Recently I've been looking at different ways to generate code coverage reports during automated builds. I'm mostly working with Azure DevOps for builds these days, as they've come a long way since the early TFS days and the hosted version is now free for open source projects. This is really nice because I have a bunch of open source projects and I understand the value provided by a good build server process. Another really nice feature of modern Azure DevOps is that its builds are stored as text files (YAML, in this case, but the format is less important than the fact it can be stored in source control rather than manually configured via a web interface). That means you can easily copy/paste a working build configuration between projects, so once you get something working, it's easy to get more ROI for your time investment because you can add the functionality to many builds. That's what I'm doing here, with code coverage.
What is Code Coverage?
Briefly, code coverage in this context refers to the percentage of the application's code that is "covered" by tests. Typically this means at least one test executed that line of code or that "code block." The percentage is then calculated based on number of lines/blocks hit by tests out of the total number of lines/blocks in the application. Code coverage ranges from 0 to 100% and there are many different tools available to measuring it, including built-in support in Visual Studio. There's a lot of detail that can go into configuring code coverage, especially if you want to exclude some parts of the application or combine code coverage from multiple test projects, but these are outside the scope of this article.
ReportGenerator
ReportGenerator is an open source tool from Daniel Palme that you can install and run on your dev machine, or there's a free Azure DevOps extension you can install so that you can run code coverage tasks as part of your build pipeline. I like ReportGenerator because it supports multiple input and output formats, it can combine outputs from multiple test projects (e.g. unit and integration tests), it's free and open source, and it integrates nicely with Azure DevOps.
If you want to quickly use the build scripts I'll show later in this article, you'll need the Azure DevOps extension installed in your organization. I don't know of a way to do this from Azure DevOps, which is odd, but you can do it from the Visual Studio Marketplace. Just go there and search for ReportGenerator:
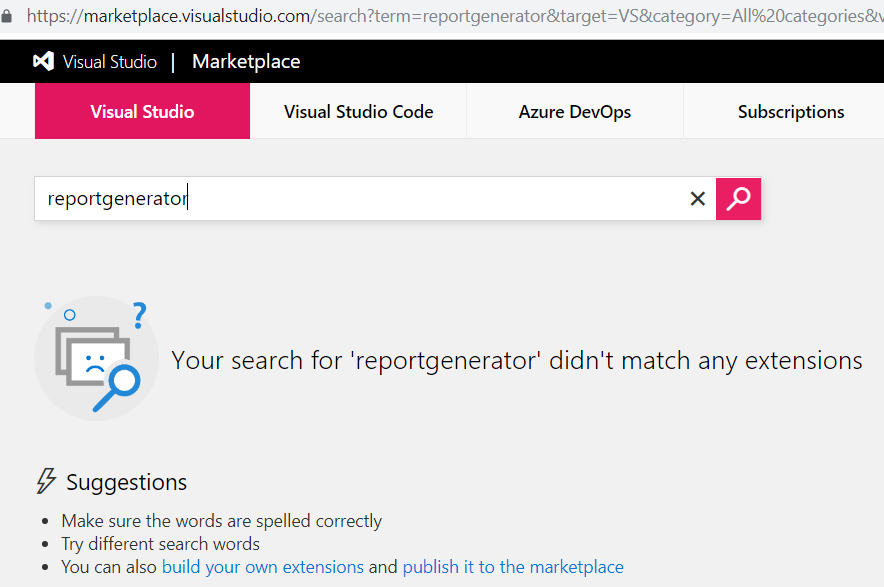
Searching for 'reportgenerator' on VS marketplace
I'm just kidding! Of course you can't just search for it! Here's the link:
https://marketplace.visualstudio.com/items?itemName=Palmmedia.reportgenerator
From there, just add it to your organization. If necessary, choose the appropriate org from the list. Once you install it, you should see this:
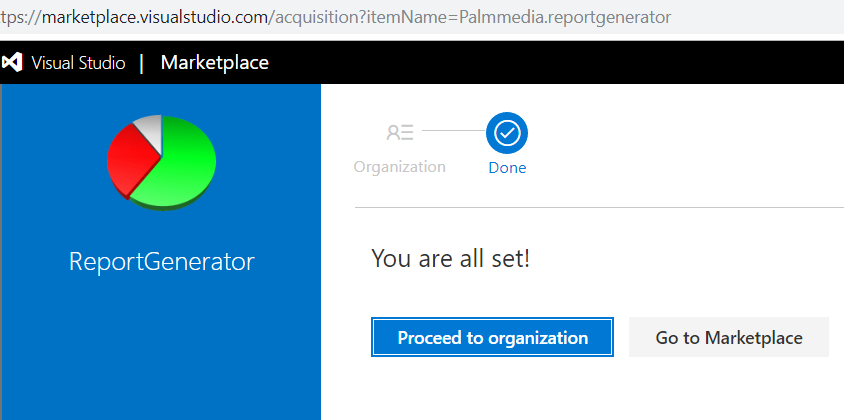
Success!
Now you can use the reportgenerator build task. If you skip this step, your build will just fail outright with an error like this one:
A task is missing. The pipeline references a task called 'Palmmedia.reportgenerator.reportgenerator-build-release-task.reportgenerator'. This usually indicates the task isn't installed, and you may be able to install it from the Marketplace: https://marketplace.visualstudio.com. (Task version 4, job 'Job', step ''.)
Just having the task defined isn't sufficient, though. You also need to add some NuGet packages to your test project(s) if you want them to be able to generate test coverage results using a particular tool or format. For example, I recently updated my GuardClauses test project to add these packages:
<PackageReference Include="altcover" Version="4.0.644" />
<PackageReference Include="coverlet.msbuild" Version="2.3.1">
  <IncludeAssets>runtime; build; native; contentfiles; analyzers</IncludeAssets>
  <PrivateAssets>all</PrivateAssets>
</PackageReference>
<PackageReference Include="ReportGenerator" Version="4.2.5" />
Now to implement the same behavior on another GitHub repo, I just need to make sure I'm using the same packages on the tests in that repo (perhaps with more recent versions).
Once you have the necessary prerequisites in place, you can add the following tasks to your azure-pipelines.yml file to generate a code coverage report inside of Azure DevOps' build results:
# Test with Coverage

# Run all tests with "/p:CollectCoverage=true /p:CoverletOutputFormat=cobertura" to generate the code coverage file
- task: DotNetCoreCLI@2
  displayName: dotnet test
  inputs:
    command: test
    arguments: '--configuration $(BuildConfiguration) /p:CollectCoverage=true /p:CoverletOutputFormat=cobertura'
    projects: 'tests/\*\*/\*.csproj'
    nobuild: true

- task: Palmmedia.reportgenerator.reportgenerator-build-release-task.reportgenerator@4
  displayName: ReportGenerator
  inputs:
    reports: '$(Build.SourcesDirectory)/tests/\*\*/coverage.cobertura.xml'
    targetdir: '$(Build.SourcesDirectory)/CodeCoverage'
    reporttypes: 'HtmlInline\_AzurePipelines;Cobertura;Badges'
    assemblyfilters: '-xunit\*'

# Publish the code coverage result (summary and web site)
# The summary allows to view the coverage percentage in the summary tab
# The web site allows to view which lines are covered directly in Azure Pipeline
- task: PublishCodeCoverageResults@1
  displayName: 'Publish code coverage'
  inputs:
    codeCoverageTool: Cobertura
    summaryFileLocation: '$(Build.SourcesDirectory)/CodeCoverage/Cobertura.xml'
    reportDirectory: '$(Build.SourcesDirectory)/CodeCoverage'
For just one test project, this doesn't necessarily buy you much more than just using the built-in code coverage capabilities that Visual Studio offers (and that you can get in Azure DevOps by using a VS2019 build agent). However, using ReportGenerator means you can easily combine multiple projects and you can export the combined files in a format that others tools like NDepend (which also has an Azure DevOps extension) can consume as part of its analysis.
Once you have everything working, you can view code coverage results in Azure DevOps for a given build as a new tab.
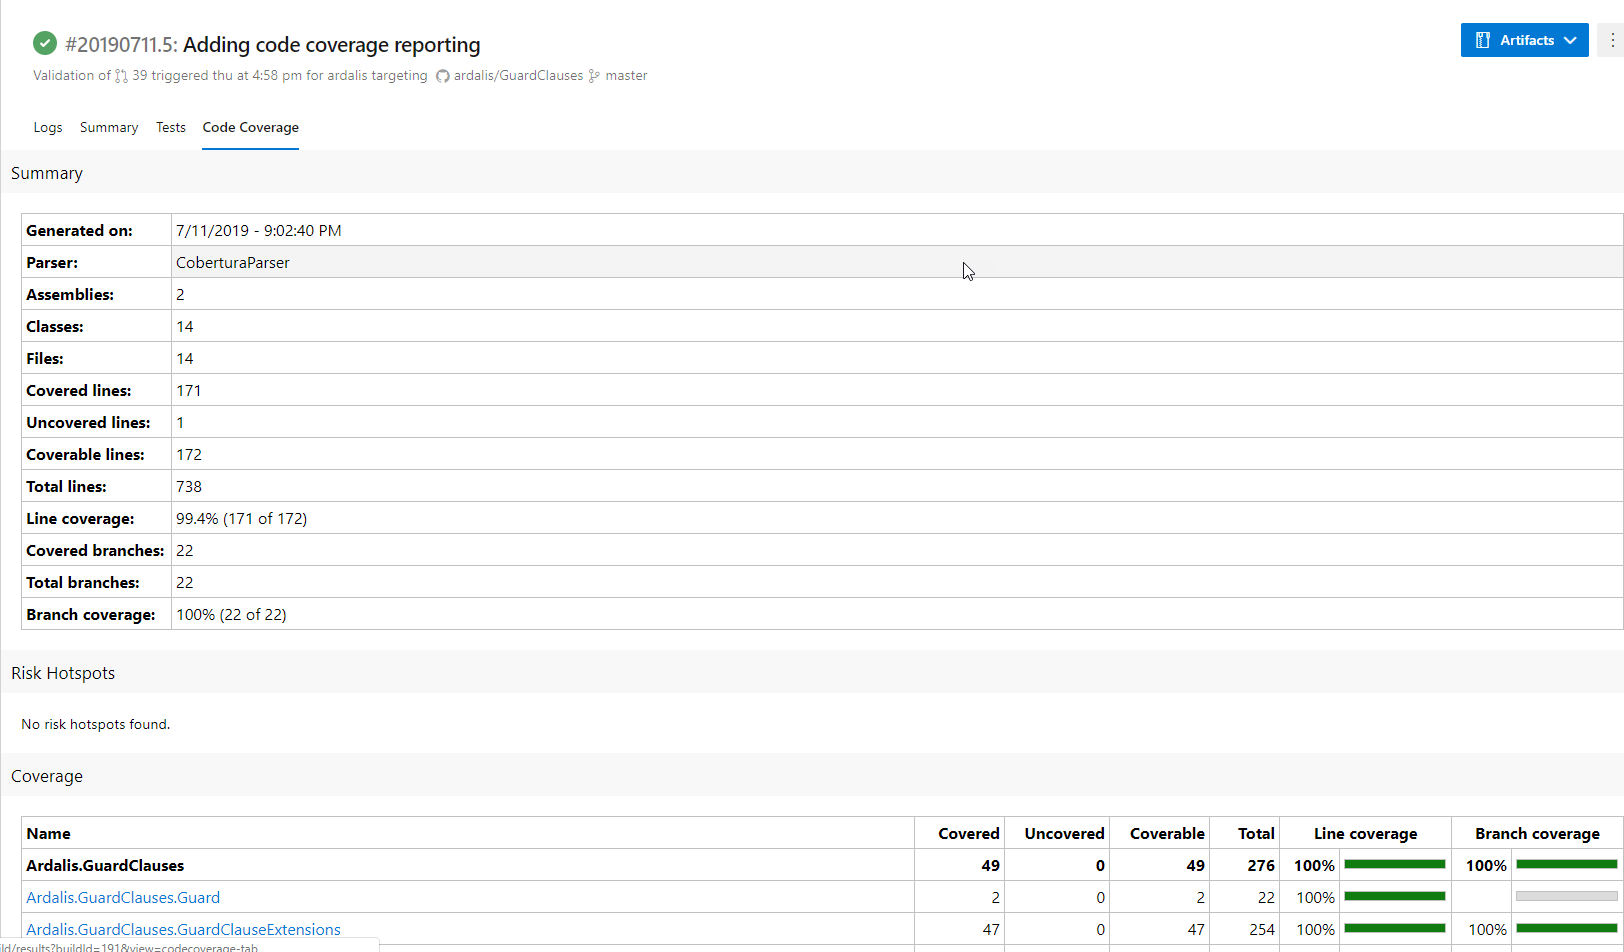
Ardalis.GuardClauses Code Coverage Report
In addition, you can display your project's code coverage in GitHub using a shield with code like this:
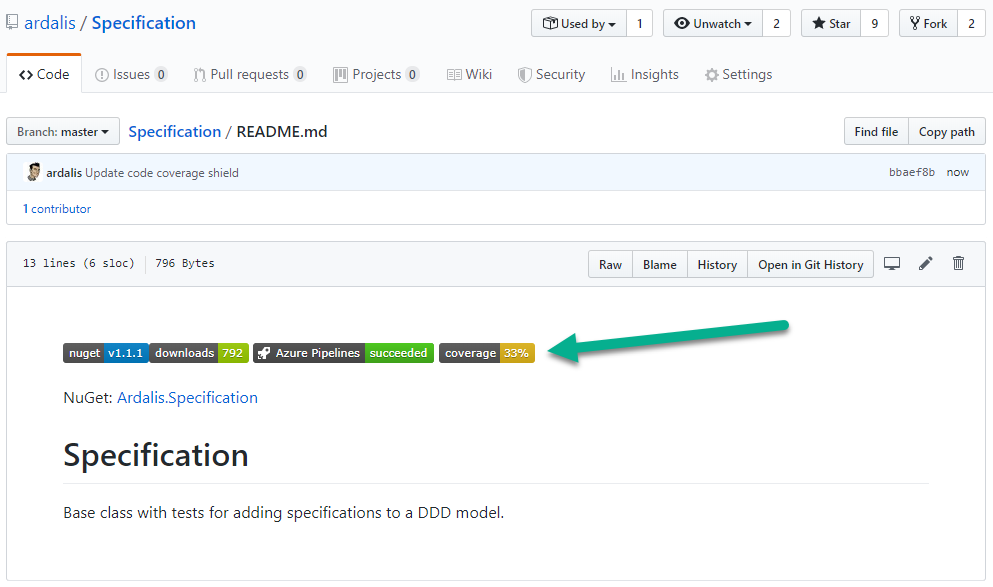
Display code coverage in project repository
You can use Shields.io to create these kinds of useful status shield /img for your projects.
Note that you can also use ReportGenerator to track code coverage over time by storing multiple build results using a custom storage provider. I haven't yet implemented this but it's something I may do in the future.
What's Next?
Once you have easy visibility into your code coverage, you're hopefully motivated to improve it. Don't go and write a bunch of tests for auto properties or other lines of code that you know are going to work. Instead, use your tool's tuning capabilities to ignore code like this, as well as generated code, framework code, and your test projects. Once you're only looking at your application logic, code coverage can provide some value as a metric, but even then I mainly only check that it's holding steady or improving, and I only get concerned if it's zero or falling rapidly.
Category - Browse all categories

About Ardalis
Software Architect
Steve is an experienced software architect and trainer, focusing on code quality and Domain-Driven Design with .NET.