Load Testing and the Requests per Second Curve
Date Published: 09 January 2019

There are a few basic curves you look for when load testing. They're pretty much standard, but there's not a lot of information out there about them, specifically. In this post I'm going to just describe one such curve, and what it tells you. It's the Requests per Second (or RPS or R/S) curve. Some tools will show you Pages per Second (P/S) which generally has the same properties.
This curve will vary with the kind of test you're running. If you just run a load test with a single user simulating a real user (with think time between actions), your R/S curve (or at least, your average R/S curve) is going to be flat over time - just like your application's load. Generally, as you increase load, your system has to increase its throughput - measured in R/S - to keep up with the increased load. It's like the baristas at Starbucks at 8am all staffed up and moving like crazy as compared to at 3pm when there are probably far fewer of them and the lines are not as lengthy.
Load tests are meant to provide information - to answer questions. A very common question you want to know about your application (and a given configuration of its resources) is, how much traffic or load can it support? One measure of this is throughput, or R/S, though alone it doesn't necessarily tell you much that's helpful since you may not immediately be able to translate that into "active users" or some other useful metric. But we'll look at that in another article.
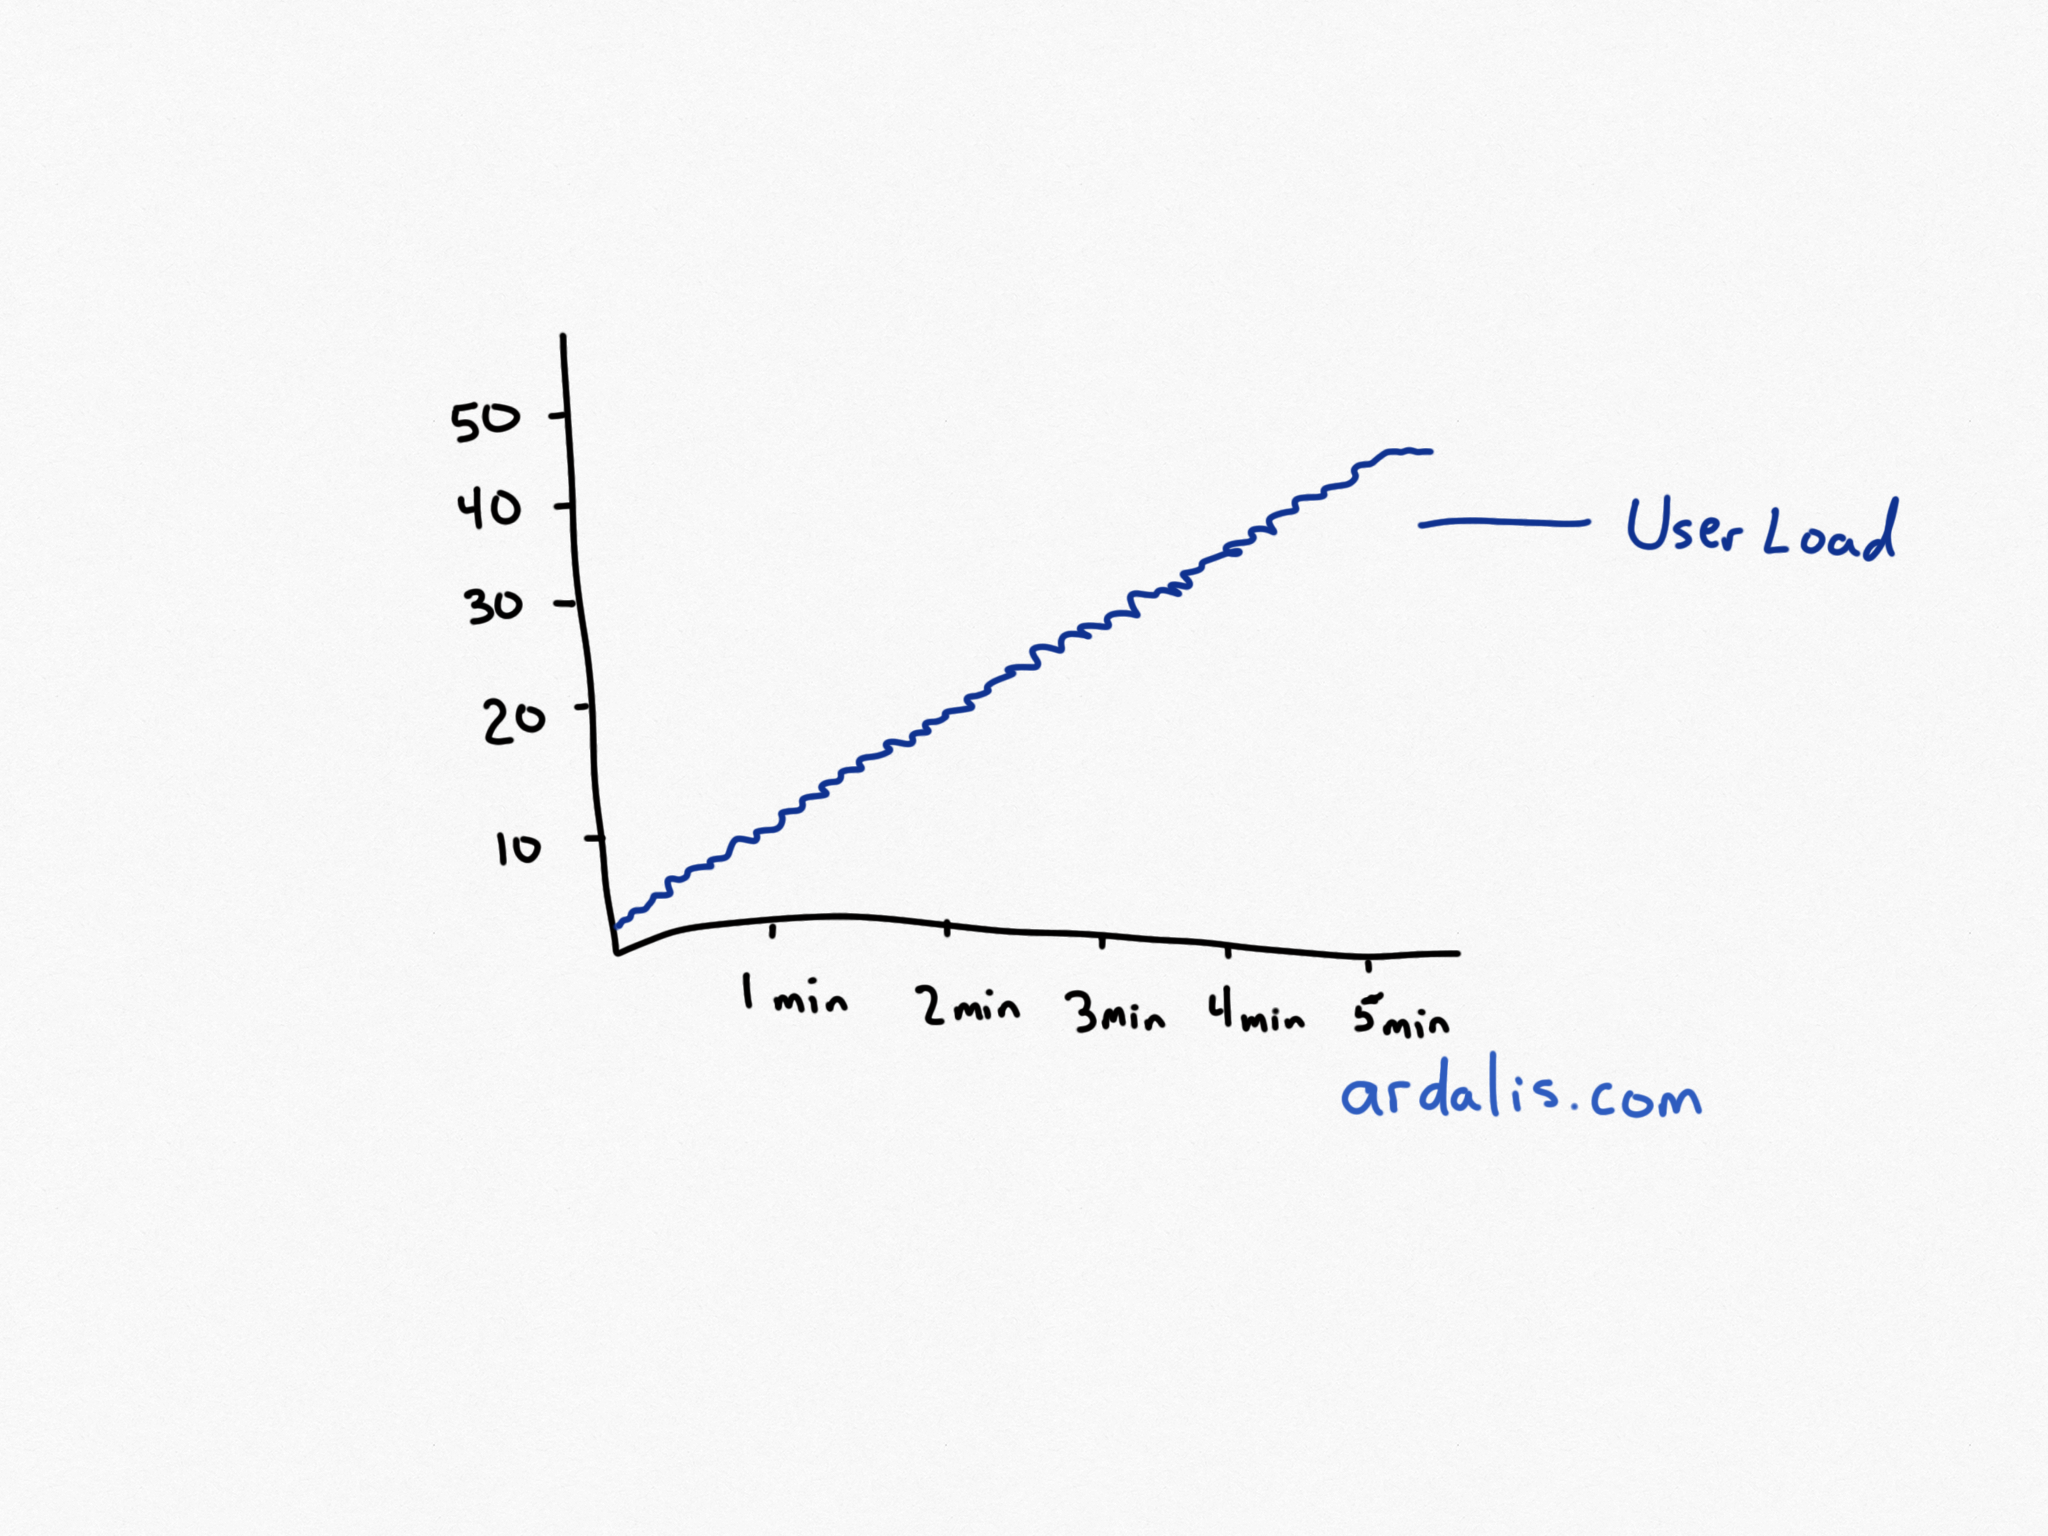
The most common way to answer the question "how much throughput can this configuration and application support" is to run a load test that steps up the amount of load progressively as the test runs. This is the kind of test I'm assuming we're using when I describe the corresponding R/S throughput curve you'll see as a result. The load starts small and grows at a constant pace. For example, 1 user up through 50 users over the course of 5 minutes (so, about 1 new user added to the load every 6 seconds, working out to 50 users in 300 seconds - tough math, I know). If you want to see what the system looks like in a steady state for a given load, then either ramp up to that load and then add some time to the test, or just run a separate fixed load test. The latter is better if you want the test's averages to be meaningful.
Ok, so we have a test we want to run, and we're going to use a step load of 1 user every 6 seconds to ramp up to 50 users in about 5 minutes (I say about because we're going to start with 1 user, not 0). The curve for these users is going to look like this:

Step User Load over 5 minutes
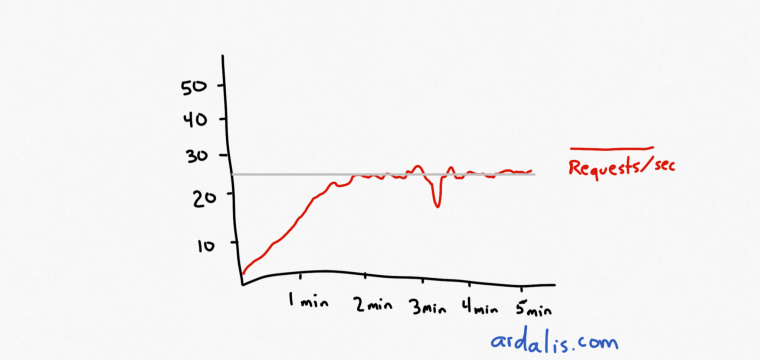
What will our throughput curve look like? Well, assuming that somewhere between 1 and 50 concurrent users (with no think time in this case) we hit a bottleneck in our system, there's going to be a point at which the throughput curve stops keeping pace with the user load curve and levels out or plateaus. Something like this:

Requests per second. I've added the grey line showing the level of the plateau.
Now, this might happen at 2 users. Or it might happen at 40 users. It depends on a ton of factors. But the curve is going to look pretty much the same regardless. It's going to start out increasing as user load increases. And then user load is going to keep going up and throughput... isn't. This throughput plateau is your application's maximum throughput with its current system configuration!
Unfortunately none of your test summary data is going to tell you this, typically. It will tell you a bunch of averages which will be completely useless because this is a dynamic test and the averages are meaningless. If you want to use the averages, you need to run a test with a static load. So, to determine the maximum throughput for your application, you need to examine the throughput curve yourself and identify the value it has when it plateaus. In the image above I've added a gray line showing where this point occurs - in most tools you can mouse over some data point on the curve and you'll get whatever value the R/S curve has at that point.
You'll probably notice something else going on in your response time graph around the time your system hits its throughput plateau, but I'll cover that in another article.
If you found this useful, or if you have any questions, please leave a comment. You may also find my Pluralsight course on Web Application Performance and Scalability Testing helpful even though it's a bit dated, since it describes many of the principles involved in planning and executing performance and load tests for web applications (and, honestly, the Visual Studio web and load testing tools have barely changed in the last 10 years).
Category - Browse all categories

About Ardalis
Software Architect
Steve is an experienced software architect and trainer, focusing on code quality and Domain-Driven Design with .NET.
