GitHub Diagrams with Mermaid
Date Published: 16 February 2022

GitHub recently announced support for diagrams embedded directly in markdown files. The new feature leverages the Mermaid diagramming and charting tool, which is JavaScript-based and supports many common diagram formats. I've solved this problem in other ways in the past and in this article I'll show how to get started using Mermaid in your GitHub projects and how it compares to other approaches.
Using Mermaid in GitHub Markdown
To get started using Mermaid all you need to do is create a code-fenced area using triple-backtick syntax and specify that your language is mermaid. Then, you need to specify what kind of diagram you're creating on the first line. Some examples include:
- classDiagram
- erDiagram
- flowchart
- gantt
- graph
- journey
- pie
- requirementDiagram
- sequenceDiagram
- stateDiagram-v2
Once you've specified the diagram type you're then free to describe your diagram using a grammar specific to the type. Note that the syntax is not consistent between types, so if you know how to draw an arrow with a label using the flowchart syntax, you'll find you'll need a different approach to perform the same task in a stateDiagram-v2 diagram.
Note that you can give hints to the diagram type like TB for "Top to Bottom" using something like graph TB. TD is "Top Down" and is the same as TB.
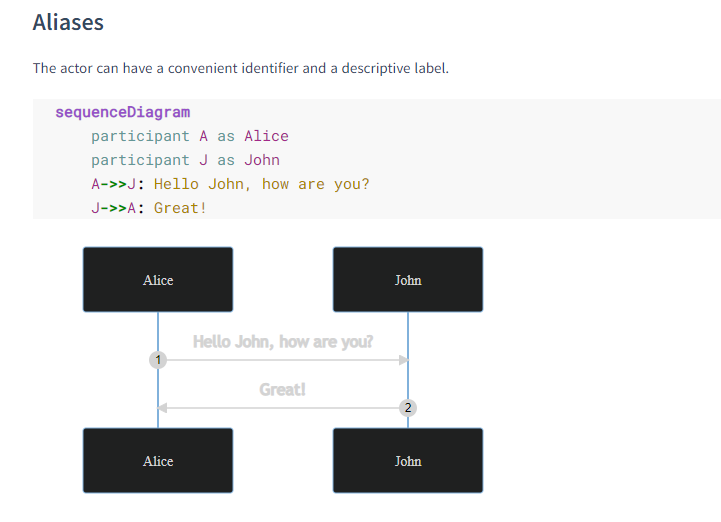
Although my blog is written in markdown, I haven't set up support for mermaid in it (yet), so the examples here will use screenshots. Below is an example sequence diagram from the mermaid docs:
State Diagrams with Mermaid and WebGraphViz
In the past when I've wanted to include a simple diagram in a GitHub README file, I've used WebGraphViz. More recently, I've used PlantUML for the same kind of thing, as shown here. These tools are web-based and text-based, but they're not built into GitHub, so you still need to render images and add the images to GitHub to reference them. What this meant is that I would typically copy-paste the text somewhere into my repo, perhaps in an issue, and then add the image there as well, and if I ever needed to change the diagram I would copy-paste the text back into the tool, regenerate the image, and do it all over again. It worked but it wasn't ideal.
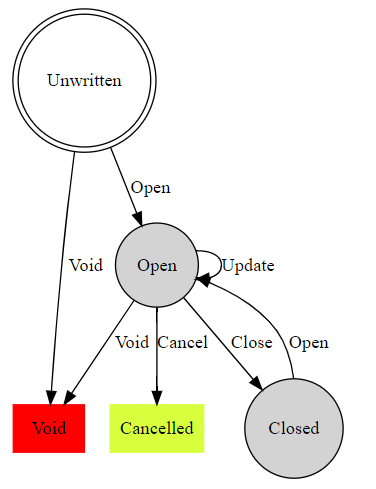
I have a GitHub sample showing how to implement the State Design Pattern which includes a diagram showing the various states and transitions a model could go through. Originally it used WebGraphViz, but I've updated it now to support Mermaid as well so that you can compare the two.
Here's the original version using WebGraphViz:
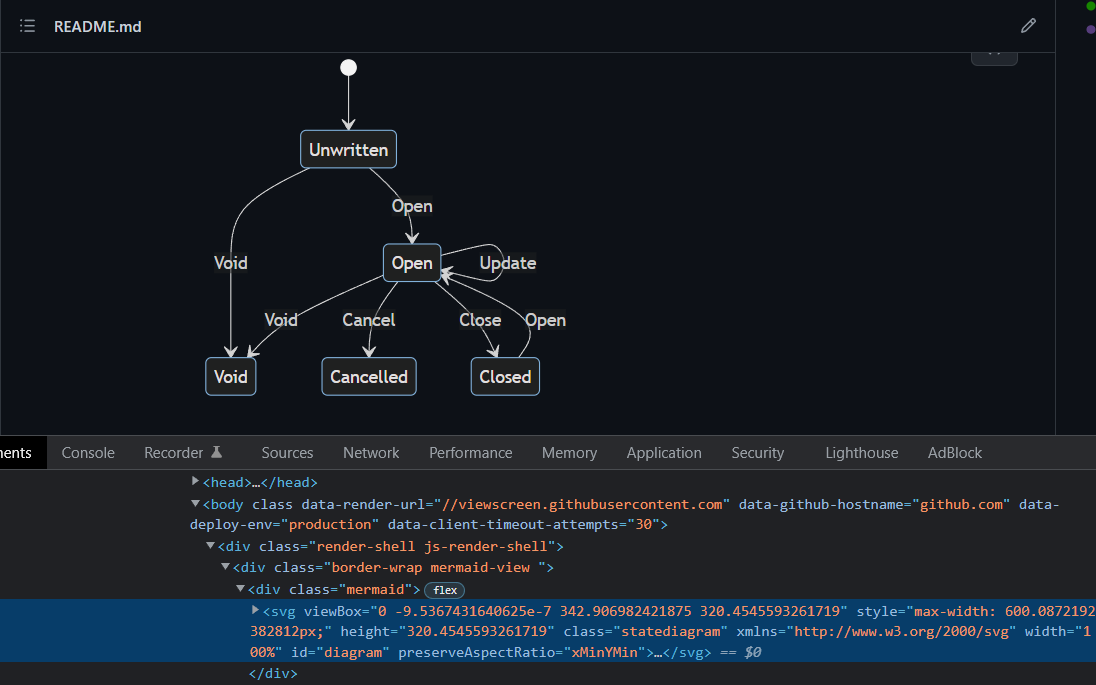
And here's the new version using Mermaid (note: the mermaid diagram is using SVG, not a rendered image):
WebGraphViz support colors for their boxes and lines applied directly to the elements. Mermaid supports theming, but I haven't yet tried to implement it. Here's an example of using local themes to override the site defaults.
Summary
The announcement from GitHub that they will support mermaid diagrams in their markdown renderer has been met with a lot of developer praise and interest. Additionally, people have commented on similar support in Azure Devops, Typora, dendron, and VS Code. It's really catching on, so if you haven't played with it yet, I'd encourage you to do so!
Category - Browse all categories

About Ardalis
Software Architect
Steve is an experienced software architect and trainer, focusing on code quality and Domain-Driven Design with .NET.