Fixing Floating Rectangles in ASP.NET StackedBar Chart
Date Published: 09 February 2012
In working on a client’s reporting system, I ran across some StackedBar charts that were using the System.Web.DataVisualization.Chart control that were having some problems. The biggest one was that the rendered bars had gaps and floating rectangles in it. This turned out to take about an hour to solve, using my best Google-fu, so I’m posting my solution and notes here, in case I run into it again and to save some other poor soul an hour’s time.
The Problem
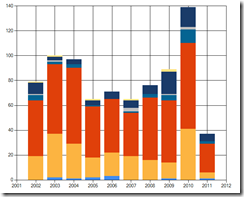
Here’s what the chart looked like, originally.

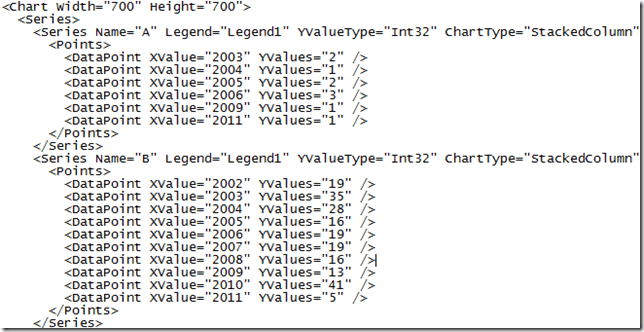
I’ll spare you the original code, as it was a total rat’s nest, but I was able to dramatically simplify it before proceeding to fix the actual issue. A bit of searching led me to believe that the problem stemmed from not having the same number of datapoints for each X value. You can actually dump the values of the chart data into an XML format pretty easily, using this command:

The resulting XML looked something like this:
Clearly, there are two problems here. The first one is that each series has a different number of data points. The second is that the points are not in order by year. You need to fix both of these problems in order to get the correct chart behavior.
Adding Empty Data Points
My first stab at adding empty data points was to use a method that seemed well-suited to the task:

Unfortunately, this didn’t fix the chart, and upon looking at my chart.xml data, it also didn’t add in any empty points. I tried a few variations but couldn’t get it to work with my data. Eventually I found a newsgroup posting with some code to do this by hand, which I ended up adapting to my needs:
<span style="color: #008000">//// now fix empty data points</span>
var xVals = <span style="color: #0000ff">new</span> List<<span style="color: #0000ff">double</span>>();
<span style="color: #0000ff">foreach</span> (var series <span style="color: #0000ff">in</span> Chart1.Series)
{
<span style="color: #0000ff">foreach</span> (var series <span style="color: #0000ff">in</span> Chart1.Series)
{
<span style="color: #0000ff">double</span> currentXValue = series.Points[i].XValue;
<span style="color: #0000ff">if</span> (!xVals.Contains(currentXValue))
{
xVals.Add(currentXValue);
}
}
}
<span style="color: #0000ff">foreach</span> (var xVal <span style="color: #0000ff">in</span> xVals)
{
<span style="color: #0000ff">foreach</span> (var series <span style="color: #0000ff">in</span> Chart1.Series)
<span style="color: #0000ff">try</span>
{ <span style="color: #0000ff">if</span> (series.Points.FindByValue(xVal, <span style="color: #006080">"X"</span>) == <span style="color: #0000ff">null</span>)
{
series.Points.AddXY(xVal, 0);
}
}
<span style="color: #0000ff">catch</span> (Exception)
{
series.Points.AddXY(xVal, 0);
}
}
}
}
<span style="color: #0000ff">foreach</span> (var series <span style="color: #0000ff">in</span> Chart1.Series)
{
<span style="color: #0000ff">foreach</span> (var point <span style="color: #0000ff">in</span> series.Points)
{
<span style="color: #0000ff">if</span> (point.YValues[0] == 0)
{ point.IsEmpty = <span style="color: #0000ff">true</span>;
}
}
}
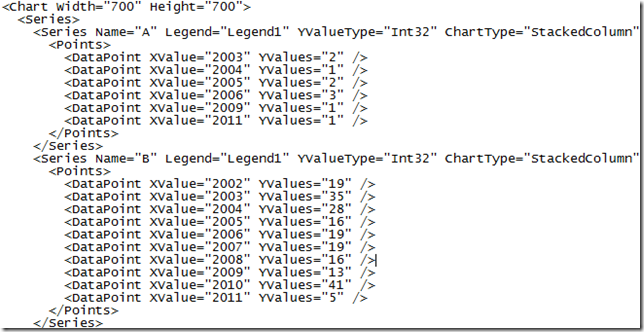
I’ll probably clean up this code further and move it into its own method (perhaps an extension method on Chart) in the future. It’s not pretty, but it does the job. With this in place, the resulting XML code looks like this:

The chart, however, is still broken.
Sorting the Points
The last step is to sort the points. This is actually quite easy to do with the following bit of code:
<span style="color: #0000ff">foreach</span> (var series <span style="color: #0000ff">in</span> Chart1.Series)
{
    Chart1.DataManipulator.Sort(PointSortOrder.Ascending, <span style="color: #006080">"X"</span>, series);
}
With this in place, the resulting XML code looks like this:
and the chart looks like this:
Summary
The charting controls available in the DataVisualization namespace are very powerful. I hope this will help some folks who are trying to get their StackedColumn chart to display propertly. Unfortunately, the documentation available from Microsoft directly on these controls is rather sparse. Hopefully this will help others who are trying to use these charts (which, by the way, can certainly be used outside of ASP.NET – in my case they are being used to generate image files that are then merged into Word and PDF reports, not for display on web pages).
Tags - Browse all tags
Category - Browse all categories

About Ardalis
Software Architect
Steve is an experienced software architect and trainer, focusing on code quality and Domain-Driven Design with .NET.