An IIS Crash Analysis Story
Date Published: 17 September 2010
Last week I attempted to update a high-traffic production ASP.NET application to ASP.NET 4. In the course of doing so, I was surprised, despite having tested everything thoroughly in a staging environment, to find that under production loads, the system was erratic and slow to respond to requests. Further inspection revealed that IIS was actually crashing under load, leaving a cryptic message in the event log but no other clues. This is basically an account of what I did, and how I ultimately resolved the issue, for my own future reference and to assist others who may face similar situations.
In The Beginning
The application in question is a fairly high traffic site, with several servers in a Network Load Balanced / Web Farm environment, and each server getting 50-100 ASP.NET requests per second, typically. The application makes heavy use of ASP.NET caching, and you can see some charts showing the behavior prior to moving to .NET 4 in my post about monitoring and tuning asp.net caching. Note in particular the Windows Task Manager behavior, with a steadily climbing memory footprint eventually followed by a “cliff” when Cache Trims occur and memory is freed. This, while not ideal, represented the status quo for the application and was what I expected to see after upgrading the application to .NET 4, with little significant variation.
Preparing for the Upgrade
The application has few individual ASP.NET pages, and in any event the upgrade from ASP.NET 3.5 to ASP.NET 4.0 was fairly painless. The biggest issue was replacing instances of my own Tuple class with the new Tuple that is now part of the .NET framework. With that done, I was able to test the application locally and all appeared well. Tests passed. Pages loaded. I checked everything in and the build server confirmed everything looked good. I deployed to stage, updated IIS there to set the appdomain to .NET 4, and tested again. Still good – no worries. This was starting to look like a walk in the park.
Performing Updates to a Web Farm using Windows NLB
I have another post detailing how to perform a rolling upgrade of a web farm using Windows Network Load Balancer. These are pretty much the steps I followed to test the move to .NET 4. I pulled one server out of the cluster, copied the stage site to the production site, flipped the appdomain to .NET 4 in IIS, and tested on localhost. Everything looked great (as it should, since it was now configured exactly like the stage site which had also tested OK). I did a Resume and Start on the node I’d pulled out using NLB Manager, and watched Perfmon and Task Manager to see how it fared.
Surprise! Finding the Problem
Watching the system in Task Manager, the memory initially started its usual slow-and-steady climb, but then it quickly (within 30 seconds) fell and remained low for another 30 seconds or so, and then it would climb again for about 30 seconds, fall, repeat. This produced sort of a saw-tooth pattern (that at the moment I can’t find a screenshot of). Looking at Perfmon and monitoring the ASP.NET Requests Executing, this counter typically would be extremely small (usually less than 1, sometimes low single digits). However, when the memory would drop in this case, the Requests Executing would start climbing at a steady pace, and would only come down once memory started going up again.
At first I thought this was some odd caching behavior, but after looking in the event log, I discovered that w3wp.exe was actually crashing. The actual error looked like this:
Log Name:      Application
Source:        Application Error
Date:          9/12/2010 12:57:47 PM
Event ID:      1000
Task Category: (100)
Level:         Error
Keywords:      Classic
User:          N/A
Computer:      Web4
Description:
Faulting application name: w3wp.exe, version: 7.5.7600.16385, time
stamp: 0x4a5bd0eb
Faulting module name: KERNELBASE.dll, version: 6.1.7600.16385, time
stamp: 0x4a5bdfe0
Exception code: 0xc0000005
Fault offset: 0x000000000000aa7d
Faulting process id: 0x960
Faulting application start time: 0x01cb529b9435da30
Faulting application path: c:\windows\system32\inetsrv\w3wp.exe
Faulting module path: C:\Windows\system32\KERNELBASE.dll
Report Id: de3deda2-be8e-11df-a35d-0014227b743d
Event Xml:
<Event xmlns="http://schemas.microsoft.com/win/2004/08/events/event">
 <System>
   <Provider Name="Application Error" />
   <EventID Qualifiers="0">1000</EventID>
   <Level>2</Level>
   <Task>100</Task>
   <Keywords>0x80000000000000</Keywords>
   <TimeCreated SystemTime="2010-09-12T16:57:47.000000000Z" />
   <EventRecordID>1157</EventRecordID>
   <Channel>Application</Channel>
   <Computer>Web4</Computer>
   <Security />
 </System>
 <EventData>
   <Data>w3wp.exe</Data>
   <Data>7.5.7600.16385</Data>
   <Data>4a5bd0eb</Data>
   <Data>KERNELBASE.dll</Data>
   <Data>6.1.7600.16385</Data>
   <Data>4a5bdfe0</Data>
   <Data>c0000005</Data>
   <Data>000000000000aa7d</Data>
   <Data>960</Data>
   <Data>01cb529b9435da30</Data>
   <Data>c:\windows\system32\inetsrv\w3wp.exe</Data>
   <Data>C:\Windows\system32\KERNELBASE.dll</Data>
   <Data>de3deda2-be8e-11df-a35d-0014227b743d</Data>
 </EventData>
</Event>
Watching the processes in the Task Manager, I noticed that the Process ID (PID) for w3wp.exe was changing, and that the process was disappearing and then, eventually, being restarted. Apparently “Requests Executing” is a bit of a misnomer, since while that counter was climbing, the IIS process was dead as a doornail, and wasn’t executing anything.
Analyzing an IIS Crash
It turns out IIS crash analysis is a bit of a dark art. I found a great blog post on IIS apppool crashes by David Wang. It pointed me to some useful tools, like DebugDiag, that unfortunately don’t work great in x64 (v1.1 is linked there, there is a v1.2 beta you can get if you contact the team though, which does work for more than analysis on x64).
In order to produce memory dumps, I used ProcDump from sysinternals. In my case it was pretty straightforward to use. I set it up like so:
procdump –64 –ma –t 1234 d:Dumps
This will result in a 64-bit dump, with full process memory (as opposed to a minidump, which is less useful), when the process with PID 1234 terminates, being dropped into the d:dumps folder.
Once I had the memory dump, I opened it with DebugDiag (1.1) and found… nothing useful. It was pretty much a waste of time.
Reproducing an IIS Crash
Unable to reproduce the problem in dev or stage with one user, I figured the issue must be some kind of load-based problem, likely a result of a bug in thread/locking code. So, while I was trying to figure out the issue on the IIS end of things, I also set up a load test in Visual Studio 2010. Since I couldn’t get the problem to occur with single requests, I figured I’d generate a whole lot of requests and try to mimic what was coming in from production. To that end, I used Visual Studio’s LoadTest and WebTest features along with dynamic querystring parameters in my WebTest, to simulate a real-world load scenario on my dev machine.
I was able to simulate the same behavior I was seeing in production using the 2.0 CLR, with Cache Trims occurring when memory pressure exceeded a configured percentage of the machine’s memory, but I couldn’t get IIS to crash, despite having largely the same configuration (64-bit, same version of IIS) on my Windows 7 developer machine as on the Windows Server 2008 production web server.
Time To Call For Help
I sent out a few emails to Microsoft product team members I know, or private Insiders mailing lists I’m on with these teams. With the information I had available, the collective advice was to call Microsoft PSS and let them debug the crash, since they’re good at this. I’d resisted doing this at first mainly because it’s been about 10 years since I’ve done so, and I didn’t relish the idea of trying to talk to someone of unknown skill over the phone about all the steps I’ve taken to diagnose the issue, etc.
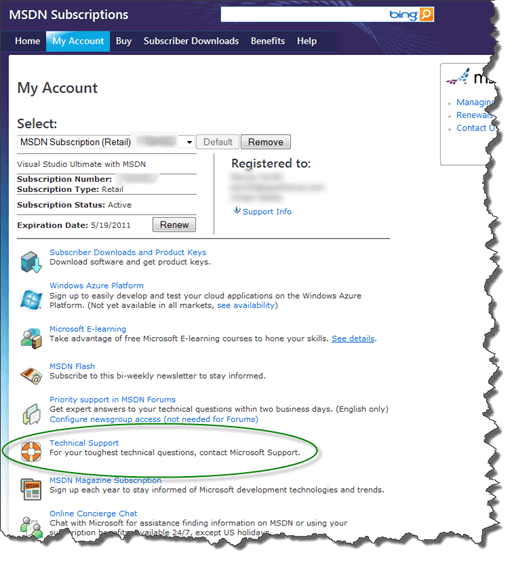
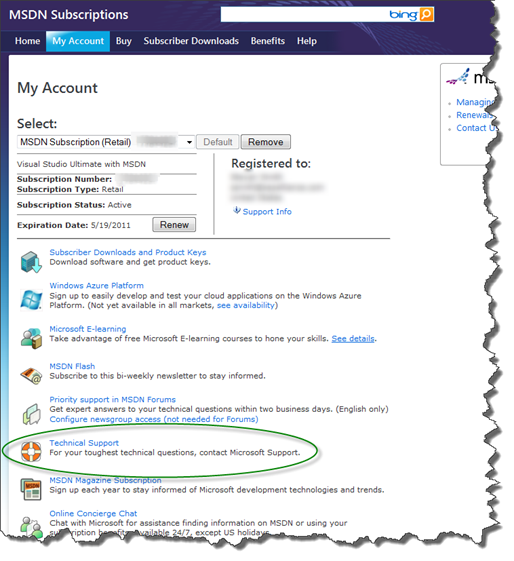
Since I have an MSDN subscription, I get a few PSS incidents for free as part of the subscription. Go to My Account under MSDN Subscriptions and click on Technical Support.
You’ll see a big list of phone numbers. I called 800-936-4900 and ended up getting routed around a bit trying to figure out how to open up a ticket. The key thing is, if you’re an MSDN Subscriber following my process, you need to get a Contract ID and Access ID. Sadly, the only way to do so apparently is via the phone. The good news is, once you have one, you can pretty much do everything via the web and email. Another phone number that may be helpful is 800-936-5800, which is a direct line for MS tech support.
Once I got my Contract and Access IDs, I submitted my incident online. The form had some issues submitting at first (grr) but eventually worked and promised I’d get a call within 4 hours. I actually did get such a call from a very helpful technician, although by this time it was evening in Ohio, so I asked him to email me with what he needed and he did so.
Working with PSS
At this point, everything went very smoothly. It was by this time a week later to the day from when I had originally tried to migrate my application to .NET 4. I sent PSS the memory dump from the server from when the crash occurred in the morning. Note that their upload tool uses ActiveX and only works with IE (sigh). However, it does work (yay!). I followed up with my technician around lunchtime (for me) to ask for an ETA and he quickly responded that someone else was analyzing the file and should know something within a couple of hours. A couple of hours later, I received an email identifying the problem!
In my case, a third party control I was using an older version of was the culprit. The issue was known and documented on their site. The resolution was simply to upgrade to the latest version of the control (or, alternately, replace or remove it). In addition to identifying the problem in the crash dump, PSS sent me the link to the resolution on the third party vendor’s site, and I was immediately able to correct the issue. (I am confused though why the issue didn’t occur previously, since it was created in 2007 and claims to be an issue with x64, but in my case I was on x64 all along, and my only change was to go to .NET 4). In any case, removing calls to the third party component eliminated the IIS crashes.
Summary
Diagnosing crashes is not something most devs have the tools or skills to do effectively, in my experience. This whole episode took about of week of calendar time, and probably a full day or two of my time, to resolve. I didn’t immediately realize the behavior I was seeing was an IIS crash, but once I did, in hindsight it would have saved a bit of time to immediately get PSS involved (especially since as an MSDN subscriber there’s no cost to doing so). Since I “didn’t know what I didn’t know” about analyzing the memory dumps myself, I figured I’d give it a shot using a tool like DebugDiag and see what it told me, but unfortunately it wasn’t able to tell me “The line of code that borked is here” or anything similarly useful, so it ended up being a dead end for me.
Once you get a ticket opened and are working with a technician, the support from PSS rocks. This was true for me ten years ago and was true this week. It was actually very refreshing to have such a nice experience with them, and I’ll be sure to use them in the future if the need presents itself.
Category - Browse all categories

About Ardalis
Software Architect
Steve is an experienced software architect and trainer, focusing on code quality and Domain-Driven Design with .NET.