Configuring Performance Counters to Run Over Time
Date Published: 05 December 2013
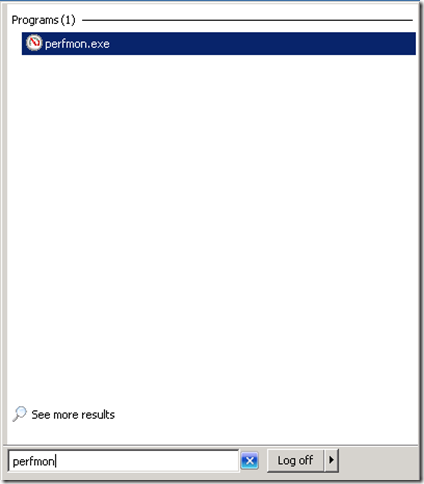
Whether you’re looking to diagnose performance problems, or just to keep an eye on the health of a server you rely on, knowing how to configure performance counters so they run constantly in the background can be a huge help. The first step in getting to performance counters is to run perfmon (just hit Start and type perfmon):
Once you’re in Perfmon, you may have questions like:
- What should I monitor for an ASP.NET web site / application?
- How do I save a set of Performance Counters?
which you can find answers to at the above links. The point of this article is to demonstrate how to collect performance statistics over time. The first step is to identify which counters you’re interested in. For this, the realtime instance of perfmon is best. It’s easy to add counters that don’t actually relate to the application you’re trying to monitor, so confirm that what you’re using will actually work before you create a Data Collector Set.
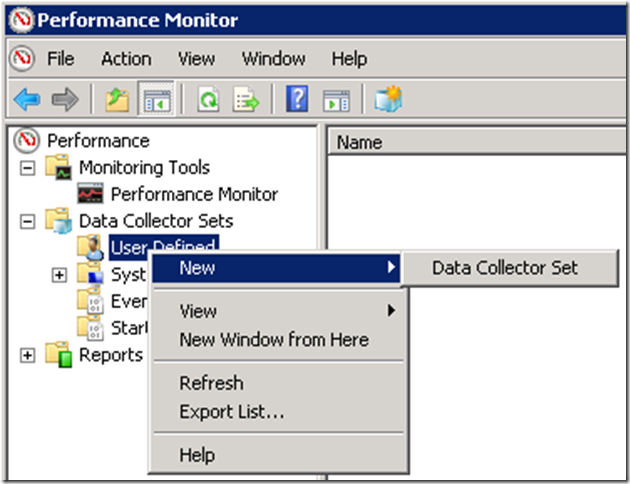
Once you know which counters you want to use, it’s time to create your data collector set. Right click on Data Collector Sets –> User Defined. Select New –> Data Collector Set.
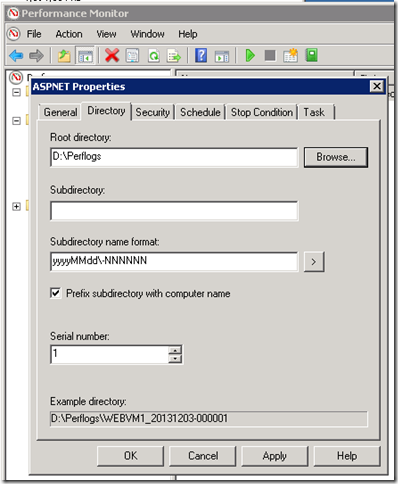
Give the collector set a name, and go through the wizard to specify which template to use, where to store the resulting files, etc. Be aware that the files will get big, depending on how many counters you add and how frequently you’re logging them. It’s best to store them off of the system drive so they won’t run the system drive out of space if left unmonitored. Once the collector set is created, you can right-click on it to view its properties (I’ve named this counter set ASPNET):
You can start and stop performance counter sets whenever you like by simply right-clicking on them and choosing Start or Stop. If you just want to run them for a short period while you perform some diagnostics, this can work great. However, for long-term monitoring it’s better to schedule the data collector to run all day, every day. To do that, click the Schedule tab in Properties. Add a new schedule, starting today, and leave all of the days of the week checked.
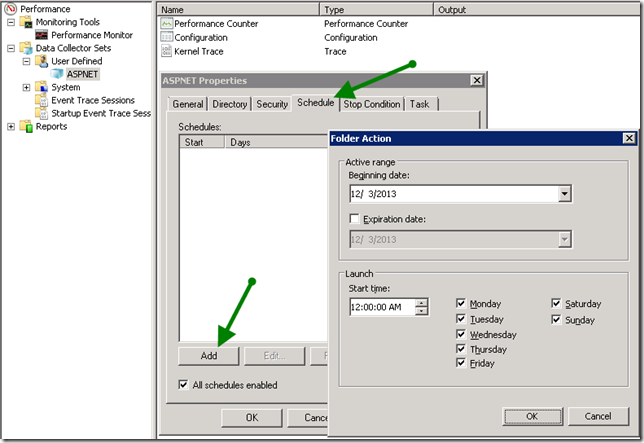
Now under Stop Condition, have the job stop automatically after 1439 minutes. Thus, it will run from 00:00:00 to 23:59:00 each day. You’ll miss the last minute. You can set a maximum size for the data collector here, too, which is useful if you’re worried about using too much space.

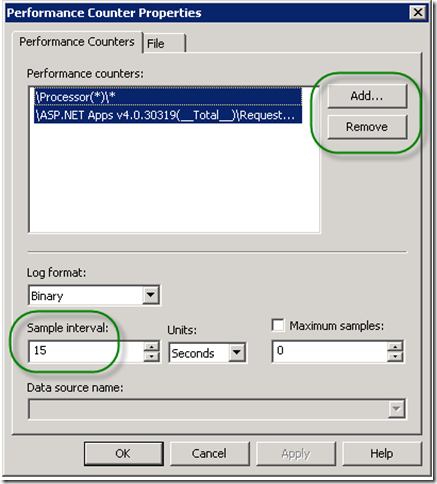
That covers scheduling. If you didn’t choose all of the counters you wanted during the setup wizard, you can modify the mix of performance counters you’re tracking in this collector set by right clicking on the Performance Counter item:

From there, click Properties, and then you can Add or Remove counters at will. This is also where you’ll want to set the collection interval. Important: if you want this to run all day long you will want to increase the interval to 5 or 15 seconds if you have even a few counters. Otherwise, the space required will be quite large.
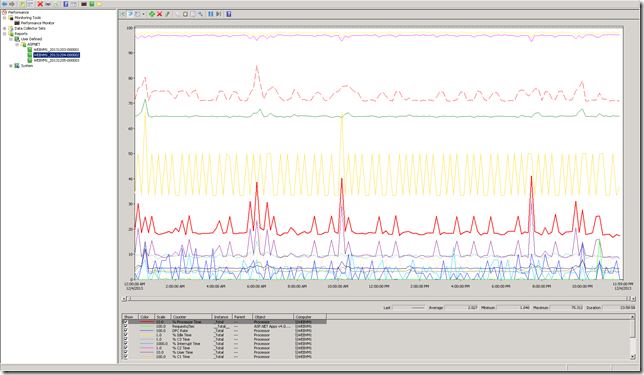
Now, let this simmer for a day or so and come back to it, and you’ll see something like this (click to enlarge):
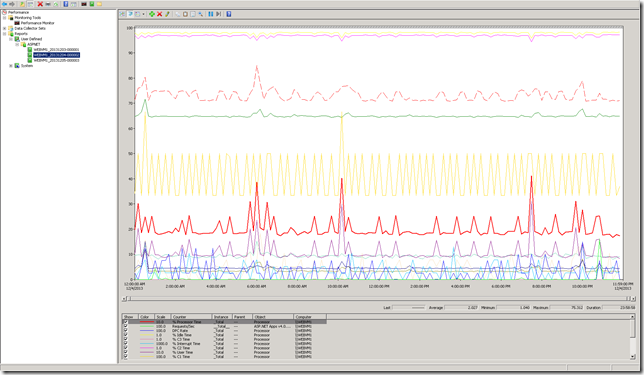
This particular example is from a VM that has one barely used website on it, but the point is that you now have a full-day view of the performance metrics for your production site. Now, in this case we’re only tracking about 17 different counters (there are 16 in the Processor/* group), and we’re only saving them every 15 seconds (rather than the default ever 1 second), so let’s see how much disk space this is consuming:
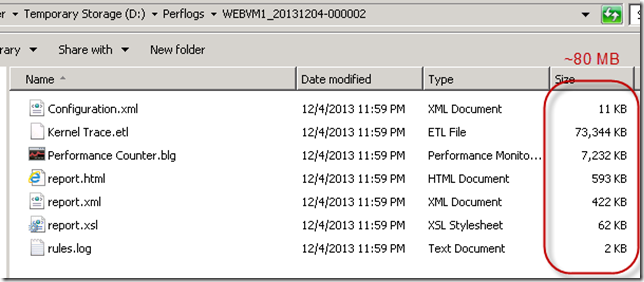
We’re looking at about 80MB of space so far. If I add a few more counters that’ll be 100MB/day, or about 3GB per month. The cheap Azure VM this is running on has a D: drive with about 70GB free, so I’m not worried about running out any time too soon, but it’s a good idea to set up a scheduled job that will delete anything older than a certain date. Otherwise, especially if you store these on your system drive, you’re going to end up running out of disk space, and that’s A Bad Thing™especially in production.
Summary
Using Performance Monitor is something move developers have at least a little experience with, but I find that many are unaware that you can have this running over long periods of time and then use it for diagnostics and analysis after-the-fact. You don’t have to be sitting there watching perfmon for it to work. By setting up User Defined Data Collector Sets, you can view reports on your production (or other) servers that will let you see what was happening when a particular event (such as downtime, or a spike in traffic) occurred, without the need to try and artificially reproduce the problem while you’re watching. And that can save you hours of time and ensure that your sites stay running better and longer.
Category - Browse all categories

About Ardalis
Software Architect
Steve is an experienced software architect and trainer, focusing on code quality and Domain-Driven Design with .NET.