How Do I Save Performance Counters in Windows Server 2008 or Windows 7
Date Published: 21 September 2010

If you’re writing multi-user applications like just about any ASP.NET application, it’s probably worth your time to get familiar with performance counters. Performance Monitor, or perfmon for short, is the tool you use to view these counters on your computer or server. You can add it to an MMC instance (run MMC and add the performance snap-in) or you can just run perfmon. (Sidenote – I once got dinged by a manager for mis-spelling perfmon in a proposal for a client. I forget what he thought I was trying to spell but it made no sense. In any event, trust me, perfmon is really how it’s spelt).
There are about 3 counters that you can work with in Windows. Wait, did I say 3? I meant about 3000+. Of these, there really are only a few that are going to be of interest to you at any particular moment, and the rest are just noise. Once you’ve identified the ones you care about, it’s nice to be able to save those to the desktop or a sync folder so that you can easily view them again later.
In the old days…
Once upon a time, it was possible to just save the settings of a perfmon session. Then you could just double-click on the saved file, and voila! You had your settings running again.
Sadly, this no longer works, and if you’re used to this simple approach, it can be quite difficult to figure out how to achieve this same functionality using the latest Windows OSes (Windows Server 2008, Windows 7, et al). Thanks to James Kehr (of ORCSWeb fame) for providing me with the answer to this.
Saving and Reloading Performance Counters with Perfmon
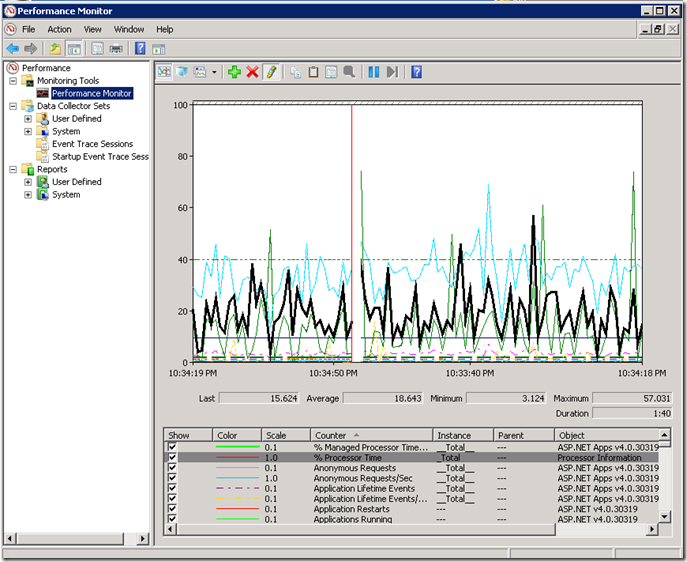
There are actually a few ways you can achieve this. The first one is the one I find myself using the most, although the latter is really the way I was familiar with in previous OSes. You can copy the properties of a given perfmon session by clicking on the Copy Properties icon (  ) next to the highlight icon above the graph. Next, open up Notepad and paste into it. Save this file somewhere handy. Next time you want to get back to the settings you were using, just open the file, copy all of the text in it, and click on the Paste Properties icon (
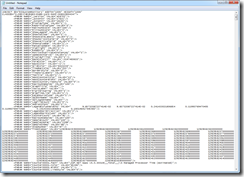
 ). If you’re interested, here’s what the data looks like (click to enlarge):
Another way you can save your settings it through Data Collector Sets. Once you have one defined and have run it to completion, you’ll have Reports you can view. You can copy and paste counters from one report to another. So, if you define a Data Collector Set and add some performance counters to it, then run it, you’ll have some reports to look at. You can look at any of these reports and simply highlight the counters you want, Copy, and then go back up to Performance Monitor (the live view) and Paste, and you’ll have the counters. This is what I do now in practice, since the counters I want to watch are in user defined Data Collector Sets now already (so I can view a whole day or arbitrary period in a day after-the-fact).
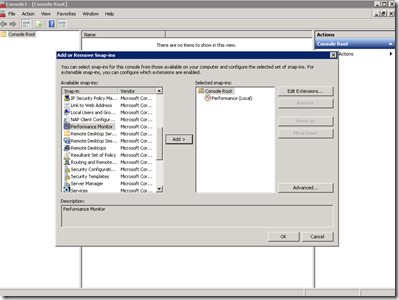
The third solution is to use the MMC. Run mmc from Start-Run, then go to File – Add or Remove Snap-ins. Add Performance to the selected snap-ins:
Add whatever counters you want, then simply save it. Back when I used to do this all the time I would have a perfmon.msc file on my server’s desktop that had the counters I was most interested in.
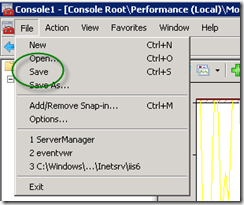
Close the MMC and you should be able to open the saved .msc file by simply double-clicking on it. This is exactly the behavior that I was used to on previous versions of Windows Server. Apparently the change is that perfmon no longer launches the performance monitor tool inside an MMC instance, but rather as a standalone process (which doesn’t directly support Save).
Summary
This frustrated me to no end for quite some time. I hope it’s been helpful to you. If you’re interested in this sort of thing, you may want to follow me on twitter or subscribe to my blog feed or email updates. If you have any tips related to this, please comment and share with others.
Category - Browse all categories

About Ardalis
Software Architect
Steve is an experienced software architect and trainer, focusing on code quality and Domain-Driven Design with .NET.