Drawing Directed Graphs with GraphViz
Date Published: 15 July 2011
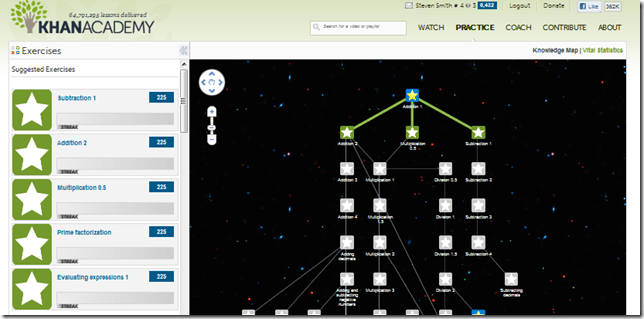
I’ve been wanting to draw some simple circle-and-arrow directed graphs for a while, because of a few problem domains I’m working in. One example pertains to articles and related educational content, which I’d like to represent as a series of modules linked by arrows that represent prerequisites. You can see a wonderful example of such a diagram on the Khan Academy’s site in their Exercise Dashboard (shown below):

Their site actually uses the Google Maps API and is dynamic. That’s beyond my needs for the moment, although I do think it’s quite cool. I just want to draw circles and links and have them rendered nicely without my having to redraw them all or move them around by hand if I decide to add one more link or node somewhere. Powerpoint falls down on this latter point. So do most simple drawing tools. I consider using DGML in Visual Studio, but it seems to only want to create graphs of Visual Studio solution elements (assemblies, namespaces, types, etc.), not arbitrary items. After much searching and posting on social networks, I stumbled upon GraphViz.
Update: If you don't care to install the EXE, check out WebGraphViz, and online version of GraphViz.
GraphViz
My first introduction to GraphViz was this video. If you’re interested in seeing how it works and reading my blog is too much work, go watch this step-by-step graphviz video. It does a great job of introducing the dot.exe tool, which is one of many tools included in GraphViz and is the one I am using now. To get started with your first drawing, download and install GraphViz from their site, and then put this into a text file:
digraph States
{
    subgraph cluster0
    {
    Draft \[color="#FF0000"\];
    SubmittedForEditing \[color="#0000FF" label="Submitted For Editing"\];
    Published \[color="#00FF00"\];

    Draft->SubmittedForEditing \[label="Submit"\]
    SubmittedForEditing->Published \[label="Publish"\]
    SubmittedForEditing->Draft \[label="Reject" color="#FF0000" style="setlinewidth(3)"\]
    Draft->SubmittedForEditing \[label="Submit with Updates"\]
    }

    subgraph cluster1
    {
        node\[style="filled"\];
        Authors \[shape="box"\];
        Reviewers \[shape="box"\];
        Editors \[shape="box"\];
    }
}
Save this file. I’m following the above video’s author’s convention of naming the files with a .graphviz extension, so I named mine states.graphviz. If you’re using notepad, be careful it doesn’t try to “help” and name it states.graphviz.txt. Next you need to locate the dot.exe file that was installed with Graphviz. Mine is located in c:program files (x86)Graphviz 2.28bin.” Assuming that’s where your file is located, and that you named your text file states.graphviz, and that you have a command prompt open in whatever folder you saved the file in, run the following command:

dot.exe -Tsvg states.graphviz –o states.svg
This will generate the file states.svg, which is a Scalable Vector Graphics file. You can open it with a text file and view its contents – it’s all text. What’s far more interesting is that you can open it up with any of the modern browsers and see the same diagram rendered. In this case, a state transition diagram with a separate box calling out the roles involved in the process. Check it out – all three major browsers, showing the same SVG diagram. Pretty freaking awesome.

A few quick notes about the syntax. You can learn more of course from the documentation and the video I linked to above. Also be sure to check out the Gallery for some interesting applications.
- digraph indicates this is a "directed graph." There are other options, this is just the one I’ve been using.
- subgraph names must be prefixed with “cluster”.
- you can specify graph- or subgraph-wide style changse to nodes by using node[attribute=”value”] as I did in cluster1 to fill the node boxes.
- there are many shape options for nodes. You can see the default ellipse and “box” options shown above.
- colors can be any HTML hex color code.
- you do not have to define every node separately. Using a node in a link creates the node. So, if you just add A->B you’ll get nodes A and B with a link between them
Summary
If you need to create drawings of graphs that may change over time, so you don’t want to just draw circles and lines in PowerPoint or a similar tool, GraphViz may be just what you need. I’ve only been using it for under an hour (plus the time to write this post) and it’s already solving two problems I had (showing state transitions in an application, similar to what’s shown above, being one, and organizing content based on prerequisites being another). So far I’ve only barely scratched the surface of what this free tool can do (the bin folder has 54 EXEs in it; I’ve used 1), but so far I’m quite pleased with it.
Category - Browse all categories

About Ardalis
Software Architect
Steve is an experienced software architect and trainer, focusing on code quality and Domain-Driven Design with .NET.